A couple of charts: Brent Crude, S&P500, AUDNZD
$CB , Brent Crude Oil:
Brent has broken out on a weekly basis, but is running into resistance. I think it's due for a pullback, which might open up a nice opportunity for a bullish trade.

$SPX500, S&P 500:
On a weekly basis, the S&P is in a shallow downtrend.
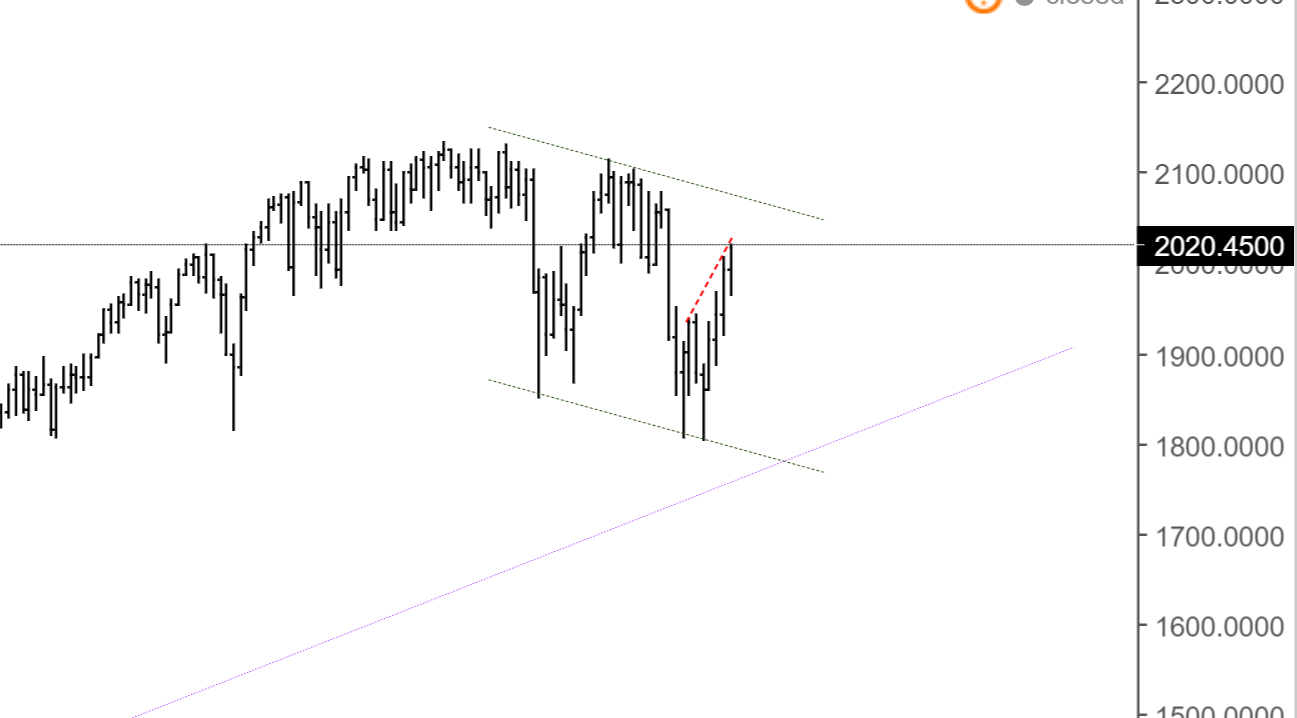
Daily, I think it is overstretched to the upside and ready to give back some of the strong recovery rally. So you might as well hedge your long exposure.

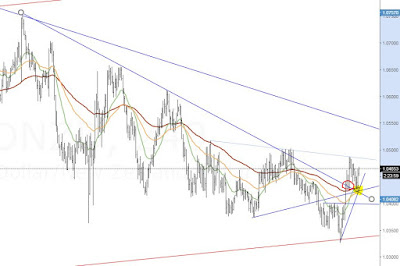
$AUDNZD:
This currency pair has been massively bullish lately. I think it can end up running to above 1.15 and even up to above 1.20 to test the trendlines shown in the charts. Hopefully, a pullback will present an opportunity to jump in on a long trade first.

* All you read here is just my opinion and certainly not investment advice.


Comments
Post a Comment