Posts

Showing posts from January, 2017

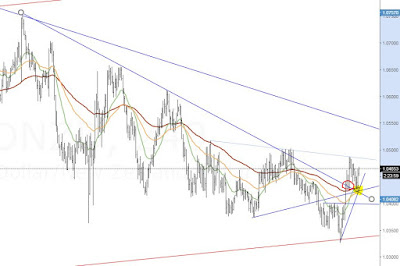
The slow sell-off in $USDCHF could come to an end very soon

Image
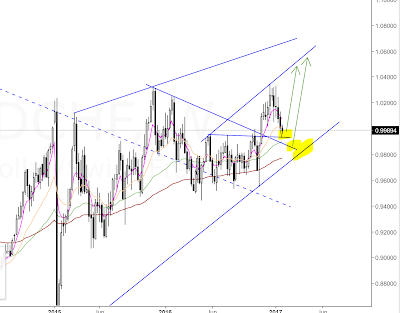
I wrote about the Swissy a few weeks back, eyeing bullish targets around 1.06 and higher. The recent grind lower in $USDCHF has been a bit frustrating. Over the last week the pair stagnated in about an 80 pip range, so nothing to see or do. But looking at the weekly chart, I still think my long-term bias is justified as the averages are bullish. The trendlines come in at around 0.9935 and 0.9885 and should provide some support or possibly the springboard to reach the initial targets which have of course only gotten better. If these lines fail though, I will run and cover my a$$... *All ideas presented here are my personal opinions and not investment advice. Take responsibility for your own investments, risks and trades!

The $DAX has been a beast lately. But can it accelerate out of its bullish channel?

Image
The German index has reached the upper end of a channel that the massive stock rallye since trump's election has completed. But can it even increase its pace and blow out to the upside of this projection? It Certainly feels once more like the markets are unstoppable with corrective moves ending shallower than California's ground water levels. My fear and ego certainly don't allow me to buy at these levels, so I will observe for weakness in this beast... *All ideas presented here are my personal opinions and not investment advice. Take responsibility for your own investments, risks and trades!

What will be the effect of this $GBPCAD support zone?

Image
$GBPCAD weekly chart $GBPCAD has reached a rather interesting long-term zone. Can this mark a turnaround for the British pound overall after May is finally giving the markets certainty about Brexit? I will keep this on my radar for favorable setups on the shorter-term timeframes. *All ideas presented here are my personal opinions and not investment advice. Take responsibility for your own risks and trades!

Buckle up $NZDUSD bulls! Why you are in for a painful ride.

Image
The $NZDUSD monthly is signalling a textbook rollover for a bearish extension of the downtrend. Trend following at its best! $NZDUSD monthly chart If it materializes the Kiwi bull is an endangered species. What will be the catalyst? There are candidates out there, like continued China doldrums, or a pop of the NZ real estate bubble. Time will tell, and as always will tell only after the markets made a large chunk of their move. *All ideas presented here are my personal opinions and not investment advice. Take responsibility for your own risks and trades!

What I want to see in $CADCHF

Image
$CADCHF has shown a messy technical picture in the past few weeks. The prolonged corrective structure first resolved to almost 0.70 on the downside, only to ignite a strong rally which broke through the trendline. Next the retest from above again violated the trendline with an overnight dip giving me some heat on long entries. $CADCHF daily chart Finally it looks as if this too will be bought for a possible extension to the upside which is my preferred scenario in the coming sessions. Go Canada :) !!! *All ideas presented here are my personal opinions and not investment advice. Take responsibility for your own risks and trades!

A roadmap for $AUDNZD

Image
After months and months of bear market activity $AUDNZD is finally signalling bullish resistance. $AUDNZD on the 4h chart The downtrend was violated (red circle) and was tested from the upside for a bullish rejection. I entered a small long at 1.0427 which I intend to hold as long as the pair is not violating the young uptrend. Longer term targets will be in the 1.0850 - 1.09 area, which currently is the intersection of a projected channel and a bearish trendline. Should the price action form a bearish pattern earlier I am bailing out of this scenario and bets are off for me. $AUDNZD daily chart *All ideas presented here are my personal opinions and not investment advice. Take responsibility for your own risks and trades!

Why $USDJPY could be heading to 135!

Image
This is one of those crazy long-term techincal projections. But look at this monthly chart! Looks absolutely feasable as long as I can't build a case for a bearish rollover. $USDJPY monthly So I started building a long position with an aggressive entry today. With swap in my favor I will hold this for the longer term and see how it behaves in the coming weeks. For my first buy I caught the trendline test marked on the daily chart. Within minutes it has popped up about 70 pips, a very promising start. $USDJPY daily *All ideas presented here are my personal opinions and not investment advice. Take responsibility for your own risks and trades!

How to trade well and lose your serenity

Image
It does not happen everyday that I get an entry right almost to the tick and the market relentlessly sprints in my favor as has happened with this $SPX500 short. $SPX500 2h chart Granted, the overall market trend is clearly bullish and this is a short-term counter-trend trade. But in an overstretched market, so I felt very comfortable letting this one ride for a downside extension. But as we can see, Mr. Market had other plans and took me out for break-even. Which of itself is a good trade. Clear entry, market turned around unexpectedly, I got out without financial consequences. But this trade actually cost me big nerve, as I helplessly watched my +20 points evaporate to zero. ZERO!!! I guess that's what they mean when they tell us that trading is a psychological game. Any tips how to keep calm?