GBPNZD trade opportunity
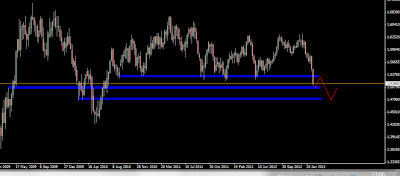
With the monthly chart breaking upwards through the MAs all waves have turned bullish and therefore, with a retracement on the daily chart the technical picture suggests a follow through to potentially the 2.20 level. With a little bit of luck, a tight stoploss can be set under 2.0360 (last daily low below current price).

Update 04/12/15
The trade is (almost) invalidated, the long side has been rejected strongly. Clearly, the weekly chart has turned bearish, The monthly is only a handful of pips from making a lower low.


Comments
Post a Comment