Posts

Showing posts with the label trendlines

The slow sell-off in $USDCHF could come to an end very soon
Image
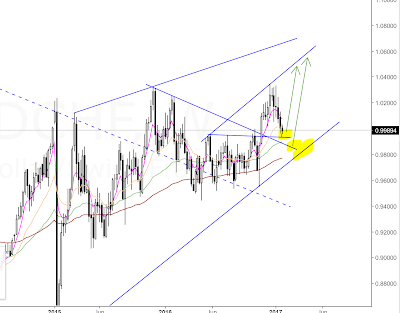
I wrote about the Swissy a few weeks back, eyeing bullish targets around 1.06 and higher. The recent grind lower in $USDCHF has been a bit frustrating. Over the last week the pair stagnated in about an 80 pip range, so nothing to see or do. But looking at the weekly chart, I still think my long-term bias is justified as the averages are bullish. The trendlines come in at around 0.9935 and 0.9885 and should provide some support or possibly the springboard to reach the initial targets which have of course only gotten better. If these lines fail though, I will run and cover my a$$... *All ideas presented here are my personal opinions and not investment advice. Take responsibility for your own investments, risks and trades!

What will be the effect of this $GBPCAD support zone?

Image
$GBPCAD weekly chart $GBPCAD has reached a rather interesting long-term zone. Can this mark a turnaround for the British pound overall after May is finally giving the markets certainty about Brexit? I will keep this on my radar for favorable setups on the shorter-term timeframes. *All ideas presented here are my personal opinions and not investment advice. Take responsibility for your own risks and trades!

Buckle up $NZDUSD bulls! Why you are in for a painful ride.

Image
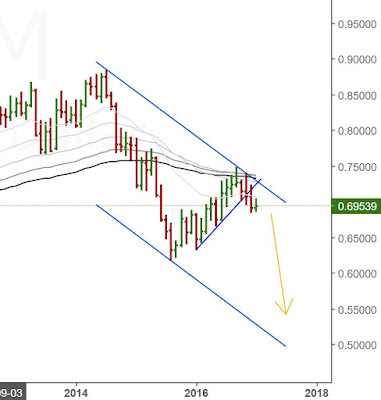
The $NZDUSD monthly is signalling a textbook rollover for a bearish extension of the downtrend. Trend following at its best! $NZDUSD monthly chart If it materializes the Kiwi bull is an endangered species. What will be the catalyst? There are candidates out there, like continued China doldrums, or a pop of the NZ real estate bubble. Time will tell, and as always will tell only after the markets made a large chunk of their move. *All ideas presented here are my personal opinions and not investment advice. Take responsibility for your own risks and trades!

What I want to see in $CADCHF

Image
$CADCHF has shown a messy technical picture in the past few weeks. The prolonged corrective structure first resolved to almost 0.70 on the downside, only to ignite a strong rally which broke through the trendline. Next the retest from above again violated the trendline with an overnight dip giving me some heat on long entries. $CADCHF daily chart Finally it looks as if this too will be bought for a possible extension to the upside which is my preferred scenario in the coming sessions. Go Canada :) !!! *All ideas presented here are my personal opinions and not investment advice. Take responsibility for your own risks and trades!

A roadmap for $AUDNZD

Image
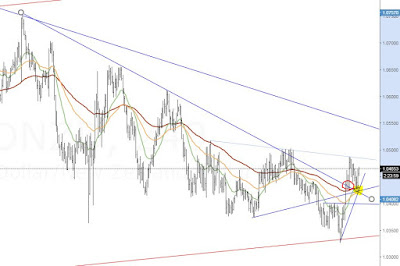
After months and months of bear market activity $AUDNZD is finally signalling bullish resistance. $AUDNZD on the 4h chart The downtrend was violated (red circle) and was tested from the upside for a bullish rejection. I entered a small long at 1.0427 which I intend to hold as long as the pair is not violating the young uptrend. Longer term targets will be in the 1.0850 - 1.09 area, which currently is the intersection of a projected channel and a bearish trendline. Should the price action form a bearish pattern earlier I am bailing out of this scenario and bets are off for me. $AUDNZD daily chart *All ideas presented here are my personal opinions and not investment advice. Take responsibility for your own risks and trades!

Why $USDJPY could be heading to 135!

Image
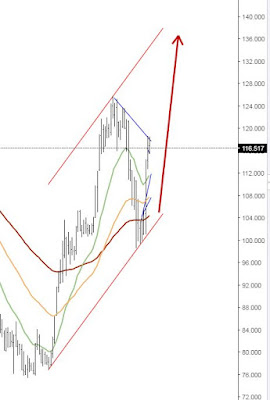
This is one of those crazy long-term techincal projections. But look at this monthly chart! Looks absolutely feasable as long as I can't build a case for a bearish rollover. $USDJPY monthly So I started building a long position with an aggressive entry today. With swap in my favor I will hold this for the longer term and see how it behaves in the coming weeks. For my first buy I caught the trendline test marked on the daily chart. Within minutes it has popped up about 70 pips, a very promising start. $USDJPY daily *All ideas presented here are my personal opinions and not investment advice. Take responsibility for your own risks and trades!

How to trade well and lose your serenity

Image
It does not happen everyday that I get an entry right almost to the tick and the market relentlessly sprints in my favor as has happened with this $SPX500 short. $SPX500 2h chart Granted, the overall market trend is clearly bullish and this is a short-term counter-trend trade. But in an overstretched market, so I felt very comfortable letting this one ride for a downside extension. But as we can see, Mr. Market had other plans and took me out for break-even. Which of itself is a good trade. Clear entry, market turned around unexpectedly, I got out without financial consequences. But this trade actually cost me big nerve, as I helplessly watched my +20 points evaporate to zero. ZERO!!! I guess that's what they mean when they tell us that trading is a psychological game. Any tips how to keep calm?

$EURUSD is rejected at channel support

Image
Just when nobody in the mainstream media is willing to bet a dime on the EUR is finally starts to show a sign of life at an important technical price level. Is this the start of a counter-trend rallye? Only time can tell, but the technical picture suggests that we will possibly see prices in the high 1.07s or even above 1.08 in the near future. Depending on how price "travels" there, I will be looking to sell into those levels. *All ideas presented here are my personal opinions and not investment advice. Take responsibility for your own risks and trades!

Warning sign on the $USDCHF

Image
Might be nothing, might be something. Congruent with the major indexes the Swissy shows a warning sign of weakness on the lesser charts. The hourly chart below shows that the steep uptrend which has delighted me so many weeks is now broken. Considering the leg's impulsive look I assume there is more to come and will lighten up on longs.

Is $USDCHF completing its correction in the uptrend?

Image
The US dollar strength is no secret. Greenbacks are appreciating against every under the sun these weeks. Since a couple of days though the dollar has been consolidating against Swiss Franc, completing a classic two-leg as the 4 hour chart shows. $USDCHF 4h chart: Can it come out of the corrective move? Now price is testing the short-term down-trend line. A break indicates the end of this correction and signal a buying opportunity. I would expect the $USDCHF to continue its uptrend towards the longer term targets. Weekly chart: I use the channels as profit targets *All ideas presented here are my personal opinions and not investment advice. Take responsibility for your own risks!

Is this going to stop the train? $SPX500 $RUT

Image
Two important US indexes are bumping up against resistance lines. Can this stop the stimulus train and allow stocks to take a breather? S&P 500 Russell 2000

$EURNZD a long-term buy?

Image
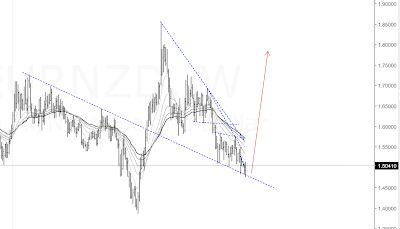
So far, the support line is holding up well. And the 4h chart presents a nice potential entry: Edit 27.01.2017: And here we go again. Sustained NZD strength and EUR weakness leads to another visit of this important long-term trendline which may present to us a great opportunity. If just there was not the heavy carry on this position... *All ideas presented here are my personal opinions and not investment advice. Take responsibility for your own risks and trades!

DAX has not cleared the downward bias

Image
It failed at what looks to be important resistance on the daily chart. So be careful everyone! *All ideas presented here are my personal opinions and not investment advice. Take responsibility for your own risks!

Is the dollar index signalling continued Fed dovishness?

Image
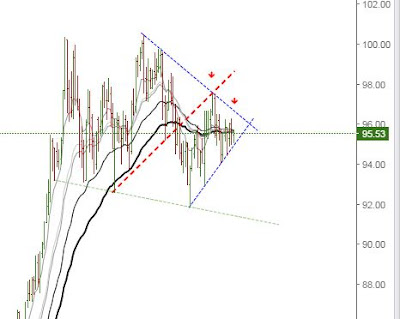
The $DXY is trading in a increasingly compressed range, coiling up for an explosive move in either direction. $DXY weekly chart After breaking the red uptrend line I am favoring $USD weakness which could be triggered by the Fed keeping rates at their current levels and not hiking in December as widely expected. Should this scenario materialize, a possible target will be the light green trendline that is currently coming in slightly below 92. *All ideas presented here are my personal opinions and not investment advice. Take responsibility for your own risks!

$DAX at critical juncture

Image
The stock markets have shown great strength in recent weeks. Still the $DAX has not managed to make any meaningful progress beyond pre-Brexit levels. This is apparent in the weekly chart: The trendlines actually show an acceleration to the downside were the German index to head south from here. Zooming in on the daily chart magnifies the double resistance that we are trading at currently: Thus I am very cautious with longs in any of the stock markets at this point. Funny coincidence was a conversation of two work colleagues I overheard recently in which the tenor was one of optimism for the economy because with $DAX over 10.000 points not everything can be bad and ugly. *All ideas presented here are my personal opinions and not investment advice.

Is this the end of the $Silver bull?

Image
Ok $Silver, this is the big test. Make or break!  Fail at this 4h-trendline?

Where to $EURUSD?

Image
Last Thursday $EURUSD delighted me with a picture perfect touch of an up-trending line. So what's next? Let's look at the situation. After last weeks rejection below 1.1150 it has shot up with vigor. Trending currently in nowhere land closely above and below trendlines, I will wait for further clues to find entries. A retest of 1.1350 will possibly offer an opportunity. If that trendline breaks though, EUR bulls are in control with a lot of upside potential.

$DAX looking horrible

Image
In my humble opinion, the $DAX looks horrible. Combined with the continued outperformance of the American indices which has to stop some day, I see potential for a landslide. Looks like its turning down on the weekly and an extension to the downside could fall faaaaarrr... The weekly: The daily: * All ideas expressed here are my personal opinions and for entertainment purposes. This is no trading advice. 

Oil on a run...for how long?

Image
I think Brent could run into some trouble. #CrudeOil #Brent

$USDCHF bullish again

Image
After weeks of bearish action $USDCHF has again turned the corner. Here the monthly chart: Also on the weekly it has broken the downtrend. Edit on June 6th: This one retraced a bit too quickly...what is it? A chance to stack up some more longs or is this totally blowing up in my face? * All ideas expressed here are my personal opinion and no trading advice.