Posts

Showing posts with the label Chart analysis

Silver devastated today

Image
$XAGUSD reached channel support. To me a screaming long! *All ideas presented here are my personal opinions and not investment advice. Take responsibility for your own risks!

Technical picture of Credit Agricole SA

Image
Credit Agricole is in a consolidation in a downtrend on the weekly chart. The consolidation has already run quite far. I wouldn't touch this on the long side until the upper falling trend-line is broken. Zooming in to the daily chart reveals that the consolidation's up-trend has already been broken but price jumped back up last Friday and today to reclaim levels above the line. Overall, I would interpret this as indecisiveness on the daily chart. In a healthy downtrend, the broken trend-line should have acted as resistance to trigger a continuation to the downside. *All ideas presented here are my personal opinions and not investment advice. Take responsibility for your own risks!

$AUDUSD challenging its long-term downtrend

Image
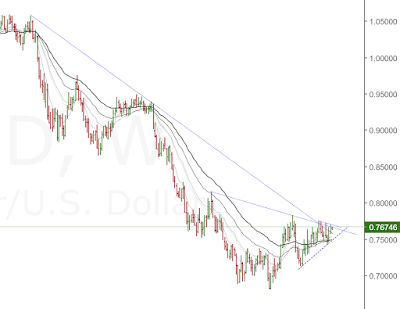
$AUDUSD has been in a downtrend for several years now. Finally it looks like this trend can be broken which would give the pair a great base from which to trade higher in the coming months. This looks very bullish. I will trade this pair from the long side until the green trend-line is broken. *All ideas presented here are my personal opinions and not investment advice. Take responsibility for your own risks!

$DAX at critical juncture

Image
The stock markets have shown great strength in recent weeks. Still the $DAX has not managed to make any meaningful progress beyond pre-Brexit levels. This is apparent in the weekly chart: The trendlines actually show an acceleration to the downside were the German index to head south from here. Zooming in on the daily chart magnifies the double resistance that we are trading at currently: Thus I am very cautious with longs in any of the stock markets at this point. Funny coincidence was a conversation of two work colleagues I overheard recently in which the tenor was one of optimism for the economy because with $DAX over 10.000 points not everything can be bad and ugly. *All ideas presented here are my personal opinions and not investment advice.

$Silver breakout and bumping into resistance

Image
Nice $XAGUSD break of the long-term channel (here a weekly chart). This is very bullish in my book. But now it's bumping into resistance on the daily, so I expect a retracement. *All ideas presented here are my personal opinions and not investment advice.

Is this the end of the $Silver bull?

Image
Ok $Silver, this is the big test. Make or break!  Fail at this 4h-trendline?

The $DAX after #Brexit

Image
This is short and simple. Ouch, what a bearish reversal after the #Brexit vote. Looks to me like and the assumption will be that the bottom of either the blue or red channel is in play as target. * All ideas expressed here are my personal opinions and for entertainment purposes. This is no trading advice. 

Where to $EURUSD?

Image
Last Thursday $EURUSD delighted me with a picture perfect touch of an up-trending line. So what's next? Let's look at the situation. After last weeks rejection below 1.1150 it has shot up with vigor. Trending currently in nowhere land closely above and below trendlines, I will wait for further clues to find entries. A retest of 1.1350 will possibly offer an opportunity. If that trendline breaks though, EUR bulls are in control with a lot of upside potential.

$DAX looking horrible

Image
In my humble opinion, the $DAX looks horrible. Combined with the continued outperformance of the American indices which has to stop some day, I see potential for a landslide. Looks like its turning down on the weekly and an extension to the downside could fall faaaaarrr... The weekly: The daily: * All ideas expressed here are my personal opinions and for entertainment purposes. This is no trading advice. 

Oil on a run...for how long?

Image
I think Brent could run into some trouble. #CrudeOil #Brent

Will silver bulls return?

Image
$XAGUSD has been correcting for several weeks now. Will the uptrend line provide support?

The bad scenario for the $DAX

Image
If this ship is going down, it will have a long way to the bottom. #DAX * All ideas expressed here are my personal opinion and no trading advice.

Can $USDSGD jump from support?

Image
Another bullish case for the $dollar. Let's see how this one plays out *All ideas presented here are my personal opinions and not investment advice.

Buying opportunity in $USDJPY

Image
Everyone was crying intervention this week when $USDJPY popped. The chart gives me an alternative reason. * All ideas expressed are my personal opinions and not investment advice.

$Silver bulls in charge

Image
$XAGUSD managed to squeeze its head above the weekly downtrend. That is bullish price action and suggests continuation. * Ideas expressed here are just my personal opinions and no investment advice.

Dow at resistance

Image
I am watching the price action in the dow for short opportunities. There is a lot of trendline confluence here, a nice spot for the market to form a top. #DJIA #Dow * Ideas expressed here are just my opinions and certainly no investment advice.

$USDCHF battling for direction

Image
The bullish breakout of recent months in $USDCHF has lost steam and clarity, but the long-term picture is still intact. Here the monthly chart: Zooming in to the weekly timeframe we see that the initial explosive up move has flattened out and actually built up bearish momentum. Short-term I expect some more pressure on this pair until bulls and bears face each other around 0.95 - 0.96. * Ideas expressed here are just my opinions and certainly no investment advice.

Dissecting AUDUSD

Image
The Australian dollar is an interesting pair at the moment. The long-term channel suggests a possible move up to about the 0.77 level. Inside the large one, there is an even steeper downtrending channel, which is pushing price towards 0.65 and lower. A shorter term bullish trendline (green dashed) will have to hold and break the blue downtrend for 0.77 to be in play. If it breaks, my expectation is a continuation of the breakdown to new lows below 0.65.

More weakness ahead for the Dow?

Image
This looks like a bear market, until the downtrends are invalidated.

A long-term look at major markets

Image
S&P 500 closed the week on or slightly below a major trendline. Dow has definitely violated its long-term uptrend and could possibly find resistance at a flatter uptrend or a downtrend channel. The DAX still seems to be the most positive chart to me, as the long-term uptrend is intact. This could change quickly though, if weakness continues into next week. Eurostoxx 50 looking similar to DAX, but closing this week slightly below the major trendline. Nikkei has broken its steep uptrend. A lower low is yet to be formed. SMI does not look healthy, breaking its rather flat uptrend to the downside. WTI Oil accelerating to the downside??? Really??? I expect a slowdown of the sell-off in the coming sessions.